
METHODS
To find locations with a burned look, I used the University of Maryland “Fire Information for Resource Management System” (FIRMS). The website uses near-real time satellite imagery from MODIS(or Moderate Resolution Imaging Spectroradiometer), a key instrument aboard the Terra and Aqua satellites, to monitor active fires over the entire globe within the last 24 hours. The MODIS satellite sensor is able to collect highly accurate thermal information about our planet at 1 kilometer spatial resolution; FIRMS runs an algorithm and flags any location which exceeds 300˚C. The raw imagery is available to the public for free through the NASA sponsored website Reverb/Echo. FIRMS archives the fires and provides a simple interface to access the data. I searched for all fires Los Angeles Country from 2010 to 2011. I then used Google Earth to look up the locations with large forest fires.
 I used GIS and Google Earth Pro to search for film locations which fit certain parameters: spacious, private, accessible, 360 degree sky views and flat ground. I downloaded elevation data at 30 meter spatial resolution (SRTM) from the USGS Seamless Data Warehouse.The “shuttle radar topography mission” (SRTM) elevation data was gathered by the Jet Propulsion Lab in 2001. This is the same data that Google Earth uses to achieve 3-Dimensional topography. The SRTM is in raster format, this means that it is a grid comprised of pixels. 30 m spatial resolution means that each pixel is 30 x 30 meters in size.
I used a software program called ArcGIS to analyze the elevation SRTM. I used the 3D surface analysis tool to calculate ground slope. I then converted the raster to vector format. This means that instead of representing the SRTM in an evenly divided grid made up of pixels, I represented the SRTM in terms of geometrical shapes called polygons. Since I was interested in flat ground with little slope, I selected polygons that had 0-3 degrees slope. I then calculated the size of those polygons in acres. Out of the polygons with 0-3 degrees slope, I selected out polygons that were between 2-30 acres. I then exported those polygons as a shapefile (SHP.). This is a type of file that stores attributes or information spatially represented by geometry – points, lines, polygons.I imported the shapefile into Google Earth Pro and then used the polygons to scout spacious, private, accessible and flat locations with 360 degree sky views.
RESULTS I created this map with the software program ArcGIS. I used elevation data at 30 m spatial resolution (SRTM) for Southern California to find flat regions between 2-30 acres in size. The pink areas represent regions which fit these parameters. I saved these polygons as a shapefile.
 I imported the shapefile into Google Earth Pro. The yellow polygons are the regions that I identified as flat and between 2-30 acres. I then scouted for private and accessible areas with 360 degree sky views.
 I overlaid information regarding protected areas (large green areas) and endangered plant species (green thumbtacks).
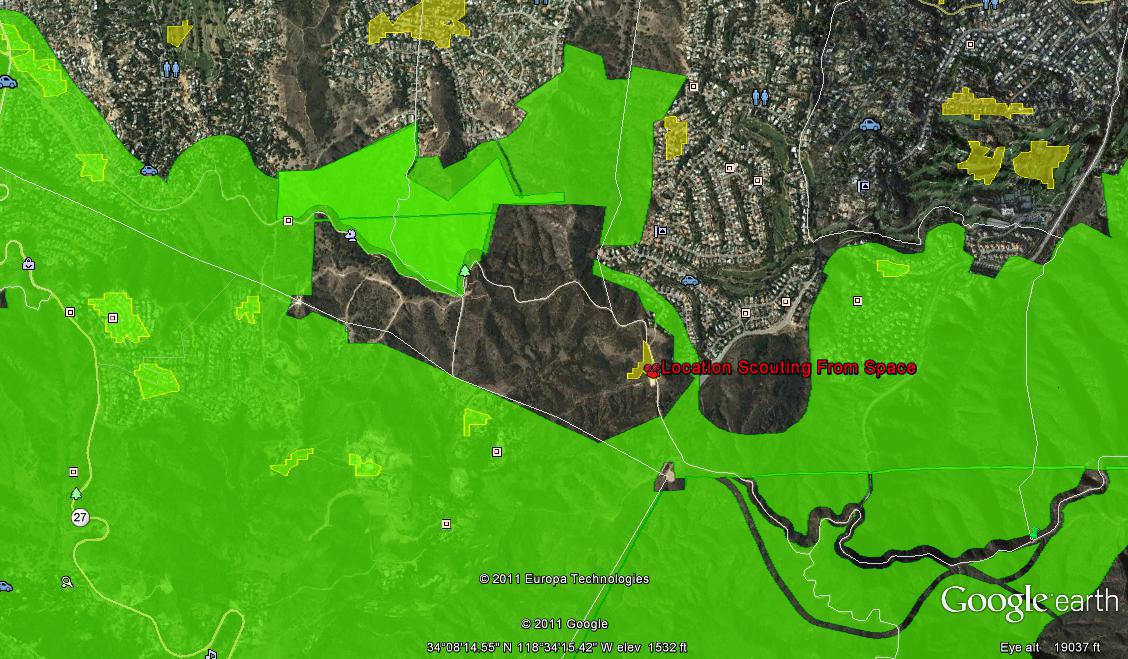 This region is in the Santa Monica Mountain Range off of Mulholland Drive (34° 8'5.74"N, 118°33'56.84"W). It is a non-protected area and there are no specimen collections for endangered plants present (this does not necessarily mean that there aren’t any critical species).
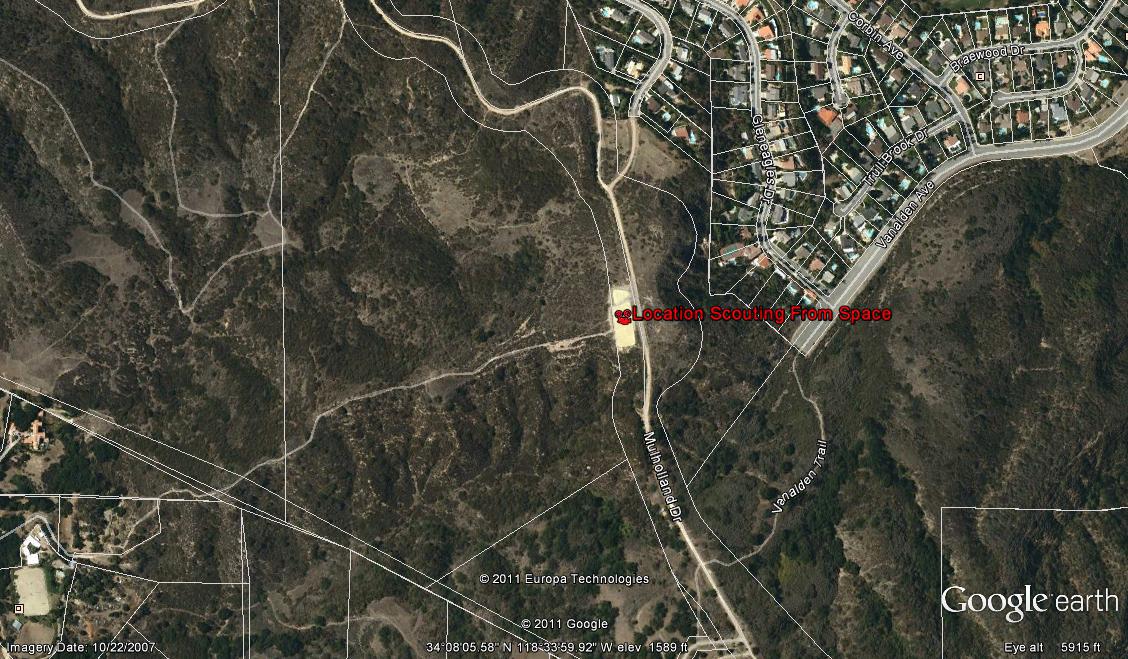 This is the same image without the overlaid data.
 This oblique angle shows that the location is on a mountain top overlooking residential area. The region appears to be flat.
 Google Earth Pro provides detailed information about the land parcel. This map legends shows the types of land use.
 The land parcel to the left of the open dirt lot is privately owned. A full report about the parcel is available from the DataQuick internet site.
 Google Earth Pro has an elevation profile tool. I drew a path on top of the road most likely to be used as an entrance to the empty lot and then used the elevation tool to determine the accessibility of the empty lot. There appears to be a dip in the road, this region may require grading or maintenance.
 I used Google Earth ground view mode to determine that this location has 360 blue sky views. I used Microsoft Image Composite Editor to make a panorama of the 360 view.
 This is the 360 panorama view from the scouted location.
FINDING A BURNED AESTHETIC

Map of all fires in Los Angeles County from 2010 to 2011. Data generated by University of Maryland “Fire Information for Resource Management System” (FIRMS).

I looked up the coordinates of the large fire regions and searched for them in Google Earth. This is an image taken on 7.15.11, the fire occurred on 12-8-10. This region might be worth scouting (34°18'10.62"N, 118° 1'0.77"W) if a film is needs a burned environment.
DISCUSSION
While it is true that a location scout will eventually have to physically go to a location to meet land owners and photograph the site, the preliminary research process can be taken to a whole new level. Taking the time to learn and implement this technology can increase the efficiency of the location scout. Envision a future where you have a live stream of the globe right on your computer screen. Think of how powerful it would be to visually monitor your database of film locations in real time.
The already groundbreaking Google Earth is just the tip of the iceberg. Google is constantly updating the thousands of satellite images which collectively make up the most comprehensive 3D model of earth available. However, the images that make up Google Earth probably represent less than 1% of high resolution satellite imagery that exists. Over 600 satellites circle our globe, some taking images of any given location with a repeat time of less than 24 hours.
Google Earth currently only displays imagery in the visual spectrum (what the eye can see) but what most people don’t know is that satellites that take each of these images also capture information that the eye cannot see (infrared & thermal). This information is not government restricted and the bulk of it is publicly available online. Some high spatial resolution imagery (0.6 - 4 m) must be purchased from satellite companies such as GeoEye, DigitalGlobe and RapidEye. A live stream of the planet can be seen with the EarthNow! Landsat Image Viewer.
With that being said, Google Earth Pro is the tool that every location scout should be using. Google Earth Pro differs from Google Earth in that it can overlay remote sensing and GIS data right on top of the earth. This is how I created the Endangered Species map that I posted in the results section. The price of Google Earth Pro is $400 for a 1-year subscription. Here are more of the highlights of Google Earth Pro:
Google Earth Pro•Promote a Location: Measure buildings in 3D and determine line-of-sight to landmarks and viewsheds to nearby parks, the ocean or the city skyline. Use Google Earth Movie Maker to produce dramatic fly-throughs, highlighting points of interest, amenities, and services.
(http://www.google.com/enterprise/earthmaps/earthpro.html):
•Survey the Site: Zoom in to properties and investigate site construction, slope, and vegetation using aerial imagery, advanced measurement tools, and the new elevation profile feature. Search for relevant businesses and community resources using Google’s unparalleled local listings to build a complete real estate profile.
•Identify Hazards and Key Underwriting Factors: Use historical imagery and Streetview to evaluate site and property features. Calculate slope elevation profiles and determine risk factors like nearby brush, steep hillsides, and seismic vulnerability. Use the circle tool to define risk proximity buffers and determine distances to electric lines, fire hydrants, and police stations.
•Access Insightful Data: In-depth earth data including over 100 global cities in high resolution, the entire US/Canada/Europe road network, location-coded yellow pages listings for millions of businesses, plus key neighborhood features including hospitals, churches, airports and schools. What’s more, Earth Pro Data Layers add compelling heatmaps overlays and data layers, including U.S. Demographic, Parcel and Traffic data.
• The US Demographics layer provides United States Census Tract data for the current year and 5-year projection. Median values within each census block, tract, county, or state are available for age, education, gender, households, income, marital Status and vehicle Availability.
• The US Parcel Data layer provides critical parcel and building information for commercial and residential real estate within the United States. Parcel points show details about a particular piece of real estate, while parcel lines show the perimeter of each parcel of land. Parcel point data includes the parcel number, country use and zoning codes, legal description, property value, property square footage, number of beds, and number of baths for residential areas.
• The US Daily Traffic Counts layer shows the concentration of automobile traffic for different areas within the United States. The data includes average daily traffic, the nearest cross street of the count, the direction from the count to the cross street, and the distance to the nearest cross street.
•Premium Measuring Tools: Google Earth offers a number of tools that you can use to measure distances and estimate sizes. Depending upon which version of Google Earth you're using, you might have access to the following measuring tools: measuring length on the ground with a line or path (all versions of Google Earth), measuring circumference and area with a polygon or circle (Google Earth Pro only), measuring 3D buildings with a path or polygon (Google Earth Pro only)
•Contact Database Management: Map thousands of addresses in the time it takes to find a single address on a map with an easy-to-use CSV spreadsheet import tool. Your data file can use street-level addressing to position each point on the Earth's surface. Google Earth can ingest georeferenced and non-georeferenced information. Leverage the CSV batch import tool to map clients, projects, and your targeted research areas before going into the field.
•Data Styling: Create thematic maps of your data with only a few clicks of the mouse. Change the color, title and height of an entire data set in minutes.
Another tool available to location scouts is the iPhone application Theodolite. It is a multi-function augmented reality app that combines a compass, GPS, map, zoom camera, rangefinder, and two-axis inclinometer. Theodolite overlays real time information about position, altitude, bearing, range, and inclination on the iPhone’s live camera image, like an electronic viewfinder. Uses are endless, and the app is great for outdoor sports, hiking, boating, hunting, golf, sightseeing, photography, navigation…and film location scouting.
